Acknowledgements & Foreword
Table of Contents
1.1. What is the Metadata Editor? 5
1.2. What is the purpose of the manual? 5
1.3. How do I prepare to document a project? 6
1.4. What do I do with the data after documenting a project? 7
1.5.1. Installation Instructions Windows** 8
1.5.2. Installation Instructions Mac** 8
1.5.3. Installation Instructions Linux** 8
2.3.1. Accessing the Template Manager 13
2.4 Importing datasets into a Project 15
2.4.1 Importing one data file 17
2.4.2 Importing multiple datasets into one project 18
2.4.3 Deleting and manipulating a datafile 18
3.3.3 Working with a grid of metadata 20
3.3.4 Working with Controlled Vocabulary 21
3.3.10 Highest level Display 25
3.4 Managing projects and navigation 25
4.2.4. Variable Information 34
5.1. Creating and Deleting Variable Groups 43
5.2. Describing the variable groups** 44
5.3. Adding variable to groups 44
5.3.1. Variable Selection Box 44
5.3.2. Adding variables across the dataset 46
5.3.3. Deleting variables in a group 46
5.4.2. Returning to the original datafile 47
6.2 Managing External Resource 48
6.2.1. Linking the External Resource 49
6.2.3. Documenting the external resources 50
6.2.4. Importing and Exporting the Dublin Core 51
6.3 Project Types using the Dublin Core 52
7.1.2 File>Import (New Project) 53
7.1.2.1 File>Import (New Project)>Package** 53
7.1.2.2 File>Import (New Project)>DDI (Codebook 2) 53
7.1.2.3 File>Import (New Project)>Geospatial (ISO19139 XML) 53
7.1.2.4 File>Import (New Project)>Dublin Core/RDF** 53
7.1.2.5 File>Import (New Project)>Nesstar Study** 54
7.1.3 File>Create new project 54
7.2.3 Documentation > PDF Documentation 59
7.5.2. Validate external resources 63
7.6.2. Templates>Data types (Schema)** 65
7.6.3. Templates>Import schema 65
Introduction
What is the Metadata Editor?
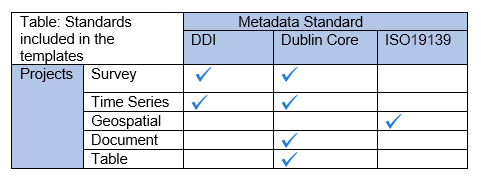
The Metadata Editor is an application designed to help document data collection operations (i.e. household surveys) undertaken for different kinds of research projects. The application is developed and supported by the World Bank and provides a high quality open architecture tool primarily targeting data producers in developing countries. The Metadata Editor applies various metadata standards recognized as global models for defining and describing different kinds of data. The following metadata standards are integrated into the Metadata Editor:
- The Data Documentation Initiative (DDI) is an international standard used to define data collection activities such as surveys and provide a structure for documenting key survey elements and data to promote and facilitate research.
- The Dublin Core Metadata Initiative (DCMI) is an international standard used to describe web based resources, electronic documents and physical resources. The DCMI is a metadata template used for describing a resource.
- ISO 19139 is an international industry standard used for describing geospatial information. The standard includes information about the “identification, constraint, extent, quality, spatial and temporal reference, distribution, lineage, and maintenance of the digital geographic data-set”. [1]
The Metadata Editor allows a data archivist a tool to systematically approach the process of data documentation by defining the following projects:
- Surveys
- Time Series
- Geospatial
- Statistical Tables
- Standalone publications or documents
Why is it necessary to use the Metadata Editor?
Aiding the researcher discover data or publications is critical to the research process and enhancing the visibility of the agency that is disseminating statistical information. The process of documenting a project is only part of the broader concept of data curation. Data Curation is an overarching process that includes data documentation but also includes the process of presenting the data for use. The Metadata Editor should be part of an integral strategy to promote the use of data and enhance data quality.
What is the purpose of the manual?
This manual is designed to provide guidance in the process of documenting a project. The manual is organized around workflow and functionality. Sections 1-6 deal mostly with the workflow of the documentation process. Section 7 provides an item by item review of the menu items and their functionality.
The manual is organized as follows:
- Section 2 covers basic workflow issues and cover the creation of projects and highlight the different kind of projects now available. Template management issues are also covered. The entire workflow for setting up a project, including importing data is covered. The section will also help the user familiarize themselves with the new dashboard layout.
- Section 3 covers provides guidance for documenting a project. The section includes guidance on how to manage different projects and provide quality tips in documentation. Throughout the manual, quality control is emphasized as part of the publication process.
- Section 4 covers documentation at the variable level and include data file descriptions and variable statistics.
- Section 5 covers variable grouping to enhance the presentation of variable level metadata and ease the discovery process.
- Section 6 covers linking external resources or any documents such as questionnaires or methodology that could be useful to a researcher.
- Section 7 provides an item by item description of all the menu items as a reference guide.
The Metadata Editor is designed to interface better with the National Data Archive (NADA) application and allow for easier exchange of metadata with a data catalog, discovery and dissemination tool.
How do I prepare to document a project?
Before documenting and archiving a project, ensure that all the relevant information needed for properly documenting a project is available. Setting up a project for documenting requires setting up a file structure that is effective and useful to the archivist and facilitates the process. The archivist or data curator should collect the data and documents related to the project under a project folder on a server. It is recommended that the data and documentation are placed in separate folders under the project folder. The documentation generated by the Metadata Editor such as the xml, wbm**. rdf and JSON can be kept in the project root directory.
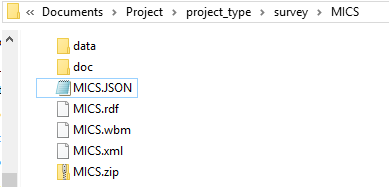
**Note: wbm file in the screen shot
- Data:
Make sure the data is the definitive final version of the data and that it has been anonymized and properly treated for dissemination according to clearly defined data dissemination policies and well-defined data processes. Depending upon whether the data will be a Public Use File or available as a licensed data file, different assumptions may have been used to include or exclude certain variables. An institution may also want to document the raw unedited data to assure that the original data as it was processed during the data collection event is archived. Different uses for the data may require different levels of treatment of the data files. Make sure the right data is being documented for the specific purpose.
- Documents
Gather up all the related documents to the project. A great deal of auxiliary information is generated in the process of planning and executing a data collection project. Place all the documents in a folder for that project. This includes vital information such as:
- Questionnaires for surveys and censuses
- Methodological documents
- Project reports and conclusions
- Analytical documents
- Relevant dissemination policies
- Other reference material useful to the researcher
Once the data curator has defined a project space and collected the data and documents relevant for the applicable project and assured proper procedures have been followed, the process of documentation will be greatly facilitated.
- Policy and Process
Make sure that proper process is followed when documenting the project. Many organizations will have a process manual with checklists and sign off requirements before the document is deemed fit for dissemination. If no such document exists, as a data curator, it may be necessary to take note of the processes that are used and record them as the basis of a process document. These could form the basis for defining a more coherent process manual. The better a process is defined, the higher the likelihood of better quality data and metadata.
What do I do with the data after documenting a project?
This is a fundamental question for the data curator. Data curation requires that the end-product for documenting the project is known and produced with the highest degree of quality. The value of documenting a project is to encourage use of the data. A project may have multiple levels of access. The level of documentation and the final platform for the project will depend on the final use of the data. Data curation does not stop at the end of the documentation phase. Data curation requires the purposeful release of the data to the user community with proper announcement and ease-of-access and ultimately the monitoring of the use and the production of research papers which can be cited. The ultimate value of a well-documented project is the number of relevant publications that are produced as a result of the availability of the data.
Installation **
**need to finalize
The Metadata Editor can be installed on Windows, Mac and Linux (Ubuntu). The applications are available from here [**].
There are two ways to install the application:
- Directly from a zip file: If a zip file is downloaded or received for
the Metadata Editor, simply unzip the contents of the file in the
desired location. The application will be unzipped with the
highest-level folder added to the path where the zip file is located.
Once unzipped, go into the folder with the contents of the
application and look for the executable file entitled:
MetadataEditor.exe. The executable file can be recognized by the
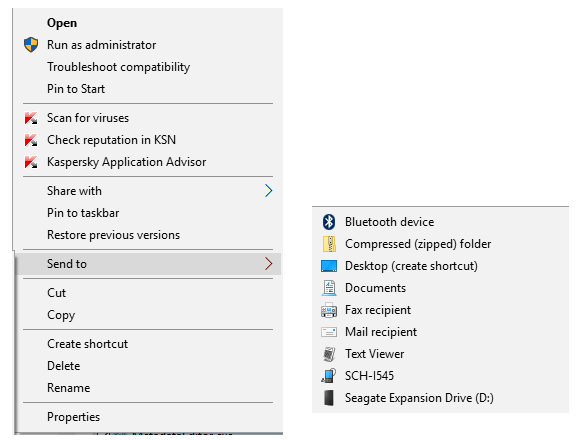
 icon. Create a shortcut on the Desktop to this executable
file. To do this,
icon. Create a shortcut on the Desktop to this executable
file. To do this,- Right click the file and select the SEND option and then the DESKTOP.
The Desktop should show the following icon:
Simply click to open
Through an installer**
Installation Instructions Windows**
Installation Instructions Mac**
Installation Instructions Linux**
Work Flow
Section 1 provided introductory information on the Metadata Editor and prepared the user for the documentation process. The user should have prepared the environment and have the required data, documentation and file structure ready for archiving.
The Metadata Editor is designed around a project. This project will depend on the kind of data or resource being documented and archived.
This section is designed to provide the user with guidance in creating a project. It will take the user through all the necessary steps to define the workspace and prepare the project for documentation. This section will cover:
- Creating a project
- Using the Template Manager
- Importing data
The section will also help familiarize the user with the dashboard layout and managing the project using the functionalities provided through the dashboard. Two practical exercises are provided:
How to create and share a project template
How to import data into a project
Getting Started
The Metadata Editor has a workspace environment that is both menu-driven and dashboard managed. The specific commands under the menu are described in Section 7. The following sections will cover the functionalities of the Metadata Editor through the workflow of documenting a project and will focus mostly on the dashboard management of projects.
After the application has loaded the user is taken to a Dashboard that includes the following areas:
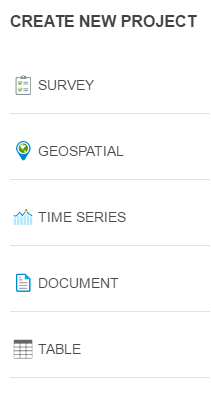
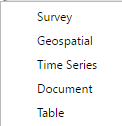
Create New Project: This allows the user to create a project of the type listed by simply clicking the type of project desired. This is found on the left margin.
Recent Projects: This provides a list of the projects that have recently been opened.
Opened Projects: This provides a list of the projects that are still open on the right margin.
Projects
The manual will now take the user through the process of creating a project through the dashboard. The table below provides the user with a brief explanation of the kinds of projects that are available.
| Project Type | Description | Special considerations |
|---|---|---|
 Survey Survey |
A survey is a research method that most often uses a questionnaire and collects information through an interview process. | -Data: multiple data files of one survey event -Metadata: DDI 2.x codebook -includes External Resources (Dublin Core support) -The ME uses the IHSN 6.0 Template |
 Geospatial Geospatial |
Geospatial data usually refers to a physical or social phenomenon that can be represented in a geographic coordinate system. | -Data: location data -Metadata: Use ISO19139 |
 Time
Series Time
Series |
Can be a collection of survey data or extractions as part of a research project. The documentation process will follow similar processes. | Data: Multiple data files across time -Metadata: DDI 2.x codebook -includes external resources -Enhanced IHSN template |
 Document Document |
A document is defined as a discrete document that is bound under a title. If it forms part of a collection of documents that help describe a survey or a data project, a document can be called an external resource. | -Data: Does not require data -Metadata: Dublin Core -The ME uses a Dublin Core template with some additional fields. |
 Table Table |
A table depicts data in tabular results. A table is usually formatted in rows (stubs) and columns. Columns can be grouped in spans. A great resource for table definitions can be found in the link below: |
-Data: processed and is aggregated depending on the presentation for each table. The ME uses a Dublin Core template with some additional fields. |
**note reference to wbm
If the user is creating a project, the user will notice the choice of the project types are provided in the left-hand column. Simply click the kind of project that is being documented.
When the user creates a project, the Metadata Editor will open a tabbed interface. All the metadata elements that are to be filled will be displayed under the project tab.
If the user has a project open, the Metadata Editor will overlay the open project with the one just created under a NEWSTUDY tab. The default name given to a created project is NEWSTUDY(X) where (X) is a number representing a sequential number of the new studies that are open.
It is recommended to save out the project to the appropriate location
and provide the project with an adequate name. The project can be saved
by clicking the  icon.
icon.
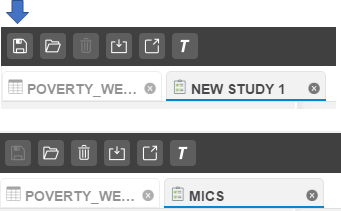
Note the name change in the tab provided in the screen shot. The project can be saved by clicking the save icon provided in the upper left (see arrow).
Also note the various options provided in the black control bar.
-Save project: This shortcut allows the user to save the current project.

-Open project: This shortcut will allow the user to open a created project.

-Delete project: This shortcut will delete the project completely.

-Import Dataset: This shortcut allows the user to import the relevant data.

-External Resource: This shortcut allows the user to create the space for attaching an external resource.

-Template: This shortcut allows a user to access the template manager.
 -A shortcut to return to the dashboard panel is provided in the
upper right-hand corner. Clicking it will take the user back to the
initial landing page.
-A shortcut to return to the dashboard panel is provided in the
upper right-hand corner. Clicking it will take the user back to the
initial landing page.
As the project will be defined by the templates which supply the formats, the next section will provide the user with information on the templates and the template manager.
Templates
The Metadata Editor uses ‘templates’ or standardized formats that are subsets of the much larger standard. Metadata standards often include many fields that are valid or valuable in certain circumstances and can be very specialized. To help the documentation, process the IHSN has generated a series of templates that simplify the process of documentation. Each template will have its own default values as well as an IHSN recommended selection of metadata fields.
The Metadata Editor makes use of three standards: the DDI, Dublin Core and the ISO19139
- DDI: Data Documentation Initiative
The DDI is “an international standard for describing the data produced by surveys and other observational methods in the social, behavioral, economic, and health sciences”. The Metadata Editor employs the DDI Codebook. This “is a more light-weight version of the standard, intended primarily to document simple survey data [2].” For more information please see their web site at: https://www.ddialliance.org.
DCMI: Dublin Core Metadata Initiative
The Dublin Core Metadata Initiative develops and maintains specifications in support of resource description resources. Resources can be any electronic file that is to be described and can include files such as: MP3 files, PDF, satellite images, tables, Microsoft Word documents etc. These are referred to as External Resources in the Metadata Editor as they are resources that help describe a project. In the case of the survey, they can include manuals, questionnaires. etc. For more information please see their web site at: http://dublincore.org. [3]
ISO19139
The ISO19139 is related to the ISO19115. The ISO19115 is a metadata standard for describing geospatial data. The ISO19139 provides the means of implementation or the XML schema. Both are related and are part of an International Standard for defining handling geo-spatial information. The Metadata Editor uses the XML schema ISO19139. For more information, please see the following site: https://www.iso.org/obp/ui/#iso:std:iso:19115:ed-1:v1:en.
The table below provides an overview of the different metadata standards as related to the project. Each metadata standard is integrated into the template that will define the project.
Accessing the Template Manager
The template manager is accessible by clicking the shortcut
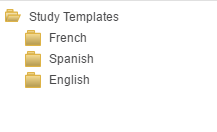
- To the left the user can select the language of the template.
- Project specific templates are defined along the top. Select the template that corresponds to the project being documented.
Under the selected tab, all the available templates will be displayed and saved in the respective language folder.

- On the right-hand side, the user will see the following choices:
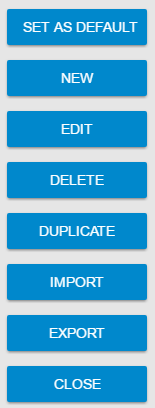
-Set as default: Allows to define the default template to use each time a project of this kind is created. Once it is selected, it will be used in other projects of the same kind.
-New: Allows the user to create a custom template usually based on the default..
-Edit: Allows to modify the content of an existing template. The user selects the template then clicks the EDIT option.
-Delete: Allows deletion of the template from the manager This option (and the edit ) is not available for the default template.
-Duplicate: This option will duplicate the selected template.
-Import: This option is used to select a template and bring it into the template manager. It will display the Windows file explorer. The expected file format will be JSON Schema.
-Export: This option exports the selected template as a JSON file.
-This will close the File Manager and return to the project.
Default Template: The user will notice that a default template is
provided. This template is recognizable as it is indicated with the icon
 to the left of the default template.
Note the following specifications under each template.
Survey (DDI) **
Need to add content for all here when the templates are done.
Time Series**
Geospatial**
Document**
Table))
Tips for starters
Note: When the user return to the project workspace the user will notice that the main section of the workspace contains specifications on the project and the tree control on the right-hand side will reflect the selected template.
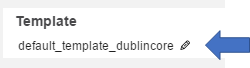
Note the specifications below. The user will notice a heading entitled “Template”. There is an active control provided at the end of the name of the active template. This control provides the user with a shortcut to select a template for a project.
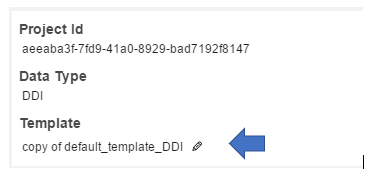
Clicking that control will display a “Change Template” box that displays all the templates. The user can verify the selected template and change the selection through this shortcut.
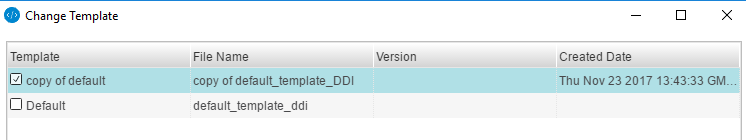
Select the template desired and click the USE button in the lower left-hand corner of the box.
Note: When trying to “EDIT” a template, if the user do not select a template to edit and click the edit button, an error message will appear:
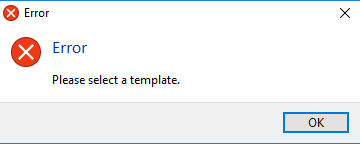
If this happens, simply select the template and click the EDIT button. Selecting the template will highlight the choice.
Importing datasets into a Project
The previous sections helped the user create a project and save the project. It also covered the process for setting a template for the project. This section will now cover the process required for importing a data file or several data files.
By the end of this section, a user will have created and saved and undocumented project that includes the data.
The user should have assembled the required documents and data for documentation. Datasets should be stored in a separate subfolder in the project directory.
The user can import various data formats directly into the project. The Metadata Editor will accept most data files from standard statistical packages. The list below shows the file formats that are currently supported.
**For SPSS ‘.sav’ files the Metadata Editor uses the defined measure unless this is very different from what seems logical. In these instances, the user will be asked during the import process, whether the measure definitions should be changed.
**Users are reminded to check the measure values that are assigned when ‘.por’ files are imported and when exporting as a ‘.sav’ file.
Importing one data file
There are various ways to import a data file into the project.
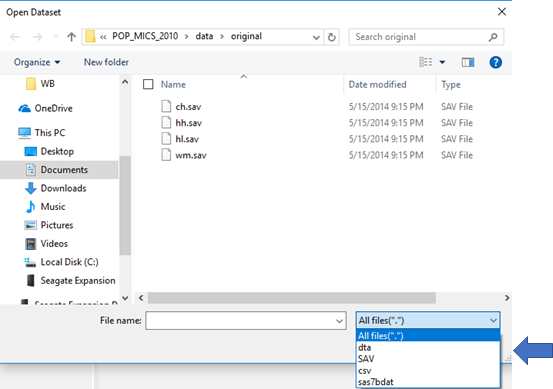
- From the control bar, click the icon. This will display the Windows Explorer. Note the file formats that are available. The Metadata Editor requires that the file format be one of the formats provided in the drop-down box. If it is not, it will not be visible. Select the file to import and click OPEN.
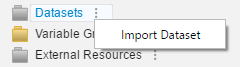
- Another way to access the datafile import functionality is through
the datafile folder or node in the control tree to the right. Note
the three dots
 beside the Dataset node. Clicking this, the
Metadata Editor will display the “Import Dataset” option. Simply
select this option and the same Windows Explore box will be displayed
as above. Select the data file to import and click OPEN.
beside the Dataset node. Clicking this, the
Metadata Editor will display the “Import Dataset” option. Simply
select this option and the same Windows Explore box will be displayed
as above. Select the data file to import and click OPEN.
- A data file can also be imported using the menu option >Data>Import dataset. This is covered in Section 7 along with all other menu driven options.
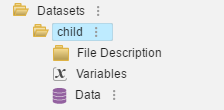
Once having successfully imported a datafile the appearance of the node in the tree control to the left will change. Under the folder dataset note the name of the file [child] and a virtual folder that will provide the key elements for describing the datafile. In addition, the [Variable] will display the variable names and the control for documenting each variable. The [Data] node displays the data values. More will be covered in the next sections which deals with document the project.
Importing multiple datasets into one project
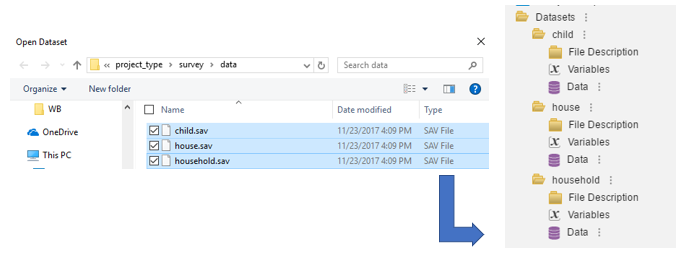 Importing multiple datafiles can also be done. Following the
same procedure already outlined, from the Windows Explorer box, simply
select multiple files by clicking the check box to the left of each file
to be imported. Then click OPEN. Each file will be displayed in its own
node.
Importing multiple datafiles can also be done. Following the
same procedure already outlined, from the Windows Explorer box, simply
select multiple files by clicking the check box to the left of each file
to be imported. Then click OPEN. Each file will be displayed in its own
node.
Deleting and manipulating a datafile
If an error has been made or for any reason the datafile needs to be deleted or moved, just click the three dots to the right of the specific data file and note the options:
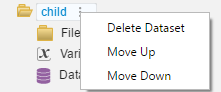
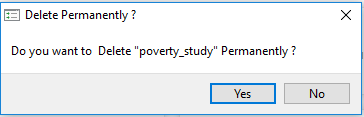
Deleting a data set will remove it from the project.
A dataset can be moved up or down depending on the desired order.
Adding Metadata
Section 2 sets up the process of documentation and the workflow for beginning a project. The section continues the workflow process and will cover the following topics:
- documenting the project
- managing projects and navigation
- quality of metadata
This section will also delve deeper into the functionalities of the user interface.
Setting Preferences**
Variable Relations**
The Metadata editor allows the user to set preferences. These preferences are…
Documenting a project
Much of the work that is required to document a project is in the preparation. Section 1 covered the documents and material required for documenting a project. There were also recommendations for developing a file structure to help organize the process of documentation. This section is organized under three metadata standards that have already been discussed: the DDI, the DCMI and ISO19139. It will provide guidance in managing the process of entering metadata. Much of the information on the specific metadata standards is provided in the template. This section covers the higher-level metadata elements. Section 4 will cover documenting at the variable level. Before looking at the specific standard, there are a few additional functionalities that apply to all templates.
Common terms
A series of common terms are established to help guide the input process. The following is provided as a reference:
Element: This is a defined field of metadata. An element will have an XML tag associated with it. The manual will refer to DDI elements or ISO19139 elements. In this case, this will be the individual field to be documented. Elements are given as the bottom most item in a tree. The screen shot displays elements of the DDI
Groups: Elements can be grouped into folders that are provided to simplify data documentation and manage the process by grouping similar elements.
Parameters: An element may have various parameters that help define the content.
Definitions
To help in the process of understanding the content required for the element that is displayed, a description of the element is provided. This description provides the user with a better idea of formats, content and documentation for that element. The descriptions help to avoid redundancies in the documentation process.
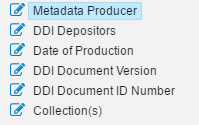
Working with a grid of metadata
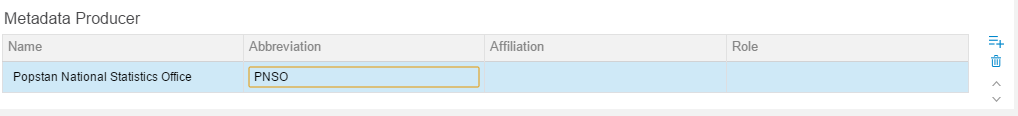
The Metadata Editor has different modes of data entry. A grid may be provided to help assure completeness of the element. Each of the parameters under an element should be completed. The screenshot shows 4 parameters under the Metadata Producer element of the DDI: Name, Abbreviation, Affiliation and Role. These parameters are unique to the element. The header row is always highlighted in gray.
Note the controls on the right. These allow the addition and deletion of rows of additional producers. Each record of a Metadata Producer will have the same 4 parameters.
Clicking this option will allow the user to add rows or records under the element. It does not provide the facility to insert but appends a row to the bottom of the list.
Clicking this option will allow the user to delete the row or record. This control will allow for the deletion of the row where the cursor is found.
Clicking this will move the record where the cursor is found up or down in the list.
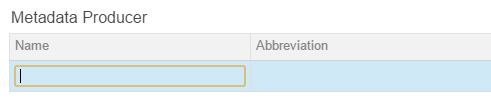
Note: The selected row will always be highlighted in blue with the active field displayed by an orange box. The cursor will be visible and flashing inside the active field.
| DDI Elements using a grid |
|---|
| Metadata Producers |
| DDI Depositors |
| Collections |
| Project Information |
| Topics Classification |
| Keywords |
| Country |
| Primary Investigator |
| Other Producers |
| Funding |
| Other Acknowledgements |
| Data Collectors |
| Access Authority |
| Digital Object Identifier |
| Contact Persons |
Working with Controlled Vocabulary
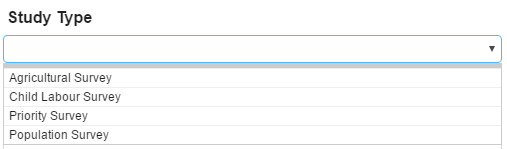
Controlled vocabulary is also often called a “drop-down” box. It provides a selection of possible terms for the user to select. Many of the DDI elements have controlled vocabulary. The elements with controlled vocabulary can be identified by an arrow control to the right of the entry box:
Clicking the arrow will display the choices that have been provided by the Metadata Editor.
A user of the Metadata Editor is limited to the choices provided. If a user tries to enter a choice that is not provided, the application will return a message “No result found”.

Working with dates
A user will also encounter elements that require dates. Keeping track of key dates in the production process is vital in the process of documentation. The Metadata Editor will require that a date me provided in Month-Day-Year format with a 4-digit year.
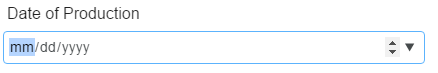
There are three ways to capture the date. Note that there are two controls provided for this element to the right of the entry field. These provide two alternatives for entering the date:
Calendar: The large downward-pointing arrow will display a calendar where the user can then pick the date.
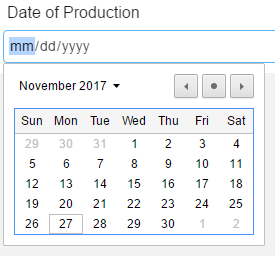
The date field provides an input mask for direct entry from the keyboard.
The Calendar control will allow navigation by:
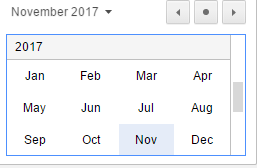
-Selecting the month drop down which helps navigate months and the years. The current year is displayed as a month calendar. Moving the scroll bar will allow the user to find a year. Moving the scroll bar up, will take the user back in time and moving the scroll bar forward will move the user forward,
 The controls to the right of the box allow the user to move
forward and backward month-by-month.
The controls to the right of the box allow the user to move
forward and backward month-by-month.Note: A user must select the date by pressing the
 record
button. This button will record the selected date into the date
field.
record
button. This button will record the selected date into the date
field.Dial the date: Selecting the double arrow control
 will
allow the user to move sequentially through a dial of numbers that
are valid for that selection. The user will notice that a selection
is required for MM (month) DD (day) and YYYY (year). Each item is
highlighted in blue. Select the proper month-day-year. If a month-day
and year is not provided, the entry will not be recorded. In the
screen shot, the month is highlighted, and the user can click through
the dial of numbers. Note that there is an X visible to the left.
Clicking the X will remove the entry in the field.
will
allow the user to move sequentially through a dial of numbers that
are valid for that selection. The user will notice that a selection
is required for MM (month) DD (day) and YYYY (year). Each item is
highlighted in blue. Select the proper month-day-year. If a month-day
and year is not provided, the entry will not be recorded. In the
screen shot, the month is highlighted, and the user can click through
the dial of numbers. Note that there is an X visible to the left.
Clicking the X will remove the entry in the field.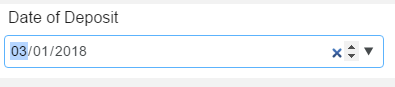
Keyboard entry: A user can simply key in the entry for MM-DD-YYYY from the keyboard. Only valid entry values will be allowed. Note that months and days have leading 0s for one-digit selections.
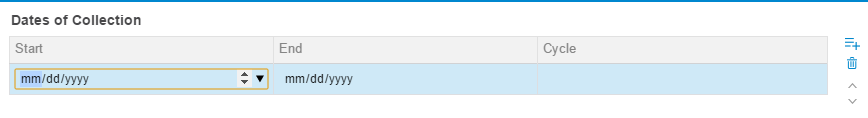
Mixed entry
On occasion the Metadata Editor will provide a mixed entry interface. This could be a grid entry with a date entry. Examples of this are in the Date of Collection and Time Periods. These are discrete periods that can be defined as repeating cycles in fielding a survey. This kind of data entry will require the start date and the end date of each discrete event. Note the screen shot provided. The two controls will work in similar ways only they are combined.
Note the calendar controls under the “Start” parameter and the grid controls provided to the right.
Regular entry
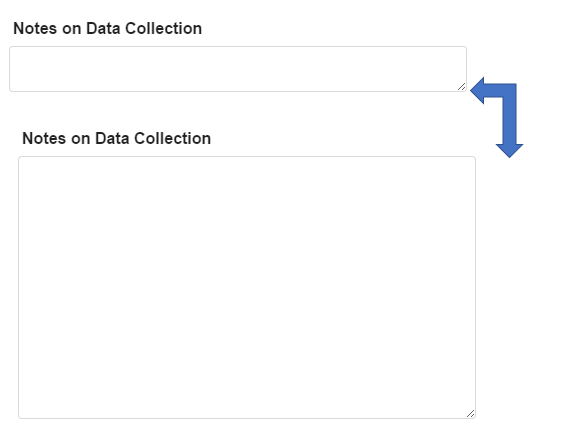
Most of the fields of data entry are defined as “Regular Entry”. These are text entry fields that accept direct entry from the keyboard or pasted from a source document. These fields are text and cannot be formatted. Right click controls for cutting and pasting are not available. A user will have to use keyboard shortcuts such as Ctrl+X (cutting) and Ctrl+V (pasting).
Please note the drag control at the bottom right of the entry field. Clicking and dragging this field will allow the user to pull up or down the field and enable the user to see more of the content space.
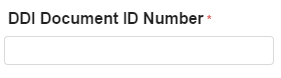
Mandatory Elements
Mandatory elements are those elements that must have an entry and are flagged as “empty” during the internal quality control process. Mandatory elements are indicated by a red asterisk (*) to the right of the element label.
*This is not part of the DCMI but is used by dependent applications to help group the documents.
Metadata Groups
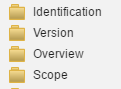
The Metadata Editor has the facility to group metadata elements in groups or categories that are related. These are virtual groupings and can assist the user by providing discrete related elements that represent a stage in the process of documenting a project. A group is recognized by a folder with a label. Note the grouping provided below. Clicking the folder will reveal the elements contained in that group.
Note that selecting the group folder will display all elements in that group on the screen together. Reviewing the metadata or entering by group can speed-up the process of documenting. The screen shot provides a view of the data entry screen grouped by “Overview”.
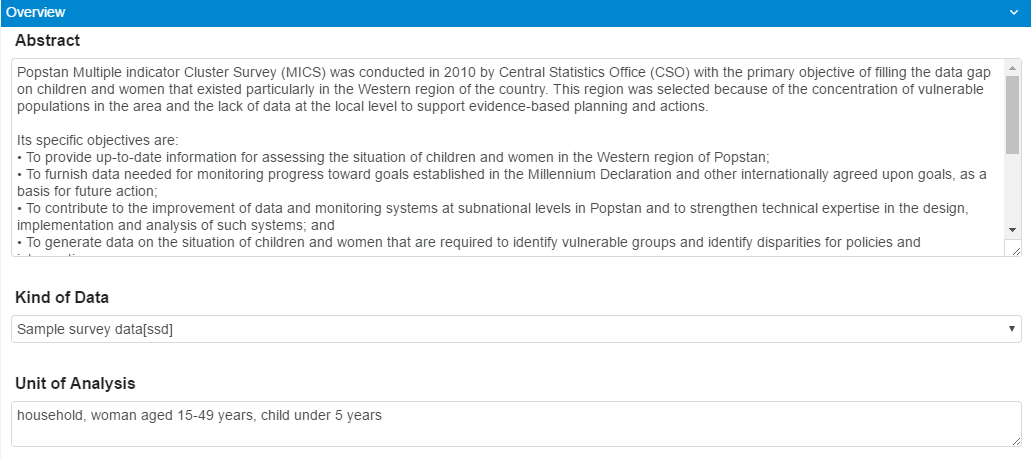
Note the arrow at the upper right-hand corner  . Clicking this
arrow will hide the grouped content.
. Clicking this
arrow will hide the grouped content.
Highest level Display
Clicking the highest-level class will also allow the user to visualize the content in a different fashion. This will display all the content that has been entered. However, the content is not editable. Note that any elements that are empty will not be displayed on the screen.
Managing projects and navigation
The previous section introduced the user to the workspace provided in the Dashboard. The section only covered the functionality to create. A user may find the additional functionality of the dashboard useful.
The user can return to the dashboard by clicking the  button to
the right of the workspace.
button to
the right of the workspace.
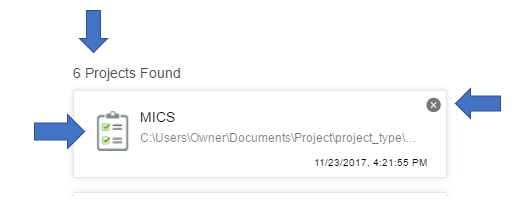
The workspace will provide labels of all projects with a total number given n the upper left (see screen shot). The project type is given by the icon. The icon types are provided in Section 2.
Recent Projects: The main display of the dashboard are the recent projects. This section will provide a running list of the projects that have been created or opened. Unless the user removes the project by clicking the X on the upper right of the project tab, the project remains available to be browsed and easily retrieved.
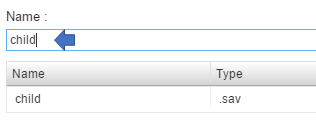
Project types can also be easily searched by using the search functionality. The search is done on the name of the project. By typing the name in the seach bar, the projects will automatically be filtered and displayed until only those projects with the name that matches what is in the search box are provided.
Note the right of the Dashboard provides tabs of all open projects. This allows the user to navigate between projects easily.
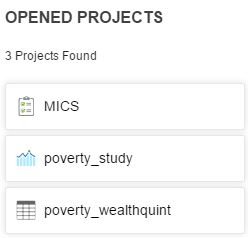
Clicking the project will open that project and the user will be taken to the project to review, edit or continue the documentation process. Note that in the workspace, tabs are also created that allow the user to navigate without returning to the Dashboard.
The tabs below in the editing mode reflect the open projects in the Dashboard above.

Opening a project: A user may find it useful to open a project that is not listed in the “Recent Projects” list. In this case, the user will have to use the menu options to navigate to the project.
The user will select the File>Open Project and using the Windows Navigator select the project to open.
Quality Tips
Quality of output is very important when producing publicly browsable content. Remember that this is a public document and a rigorous review process should be implemented before releasing the content on a public web site. These quality tips are provided to the user to assist with the process of documentation:
Cutting and Pasting:
The Metadata Editor allows a user to cut and paste content from any document into the editor. The content is unformatted text. All the text in the Metadata Editor is unformatted. Make sure when cutting and pasting content, it is properly reviewed, and relevant information is provided. Check areas where formatting in the source document may cause the content to display in an unprofessional manner. Always doublecheck content that is cut and pasted.
Keystroke controls:
The Metadata Editor does not have right click cut and paste options. The user will have to use keystroke controls such as Ctrl+V to copy and Ctrl+C to paste. Note the various shortcuts available.
| Command | Description | Shorcut keys* |
|---|---|---|
| Undo | This command is used to undo the last keyboard operation called. | Ctrl+Z |
| Redo | This command is used to repeat or recover the last keyboard operation called. | Ctrl+Y |
| Cut | This command allows the selection of text and removal, while storing to the clipboard. | Ctrl+X |
| Copy | This command allows selection of text and copying to the clipboard for pasting. | Ctrl+C |
| Paste | This command allows the insertion of the text stored in the clipboard to the active field or document. The paste will paste the content at the point where the cursor is located. | Ctrl+V |
| Select All | This command will select all text in the active document without having to highlight the area with the cursor. | Ctrl+A |
Understand the descriptions:
Each metadata element is provided with a description of what is expected under the content. The user should review the content provided and make sure they understand what the element requires. Only provide content that is sought for under that element.
The following table provides useful shortcuts to help in the documentation process.
Datasets
In Section 2 the user learned how to import a dataset into a project. Section 3 covered the basics for documenting the higher-level elements of a project.
This section will go into deeper details on the documenting process and follows the workflow process to the variables. The section will introduce the user to the following concepts and processes:
- Data File Description
- Variable level documentation including
- Variable Statistics
- Variable Documentation
- Variable Information and Categories
- Navigating through variables
- Grouping variables
- Viewing data
By the time the user has read through this section, he or she will have a basic understanding of documenting the different projects to the variable level.
Data File Description
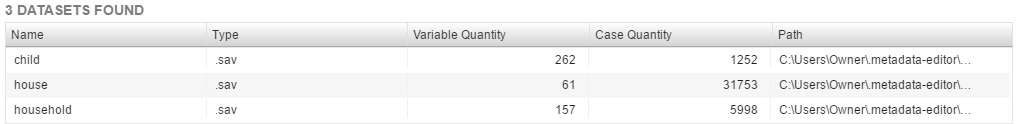
The user should already have imported some data files as this was covered in Section 2. The data files are grouped under the icon “Datasets”. Clicking the highest-level icon, or Datasets will display a grid of all the datasets with some summary information. This includes: Name, File type, Number of variables, Number of cases (records) and the location of the data file.
Clicking the next level of the individual data file will provide the user with another summary page however note that the name of the datafile is editable at this level. Placing the cursor in this field will allow the user the ability to change the label of the datafile.
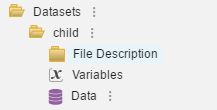
As the user drills down deeper into the individual datafile he or she will note that each datafile in the project will have the following content structure with: File Description, Variables and Data (see blue arrows).
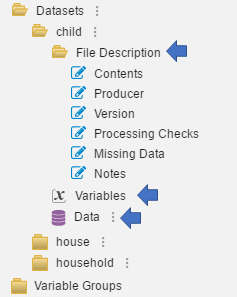 The “File Description” contains various elements much the
same way as Document Description and Study Description. The difference
is that each data file within the Datasets will have its own file
description. The user will see 6 items displayed under File Description:
Contents, Producer, Version, Processing Checks, Missing Data and Notes.
The “File Description” contains various elements much the
same way as Document Description and Study Description. The difference
is that each data file within the Datasets will have its own file
description. The user will see 6 items displayed under File Description:
Contents, Producer, Version, Processing Checks, Missing Data and Notes.
The interface will display all items when clicking the upper level File
Description icon 
or individually by clicking  .
.
The fields of entry are regular entry data fields and follow the same procedure for entering and editing content as covered in the previous section.
Variable Information
Clicking the  icon of the individual datafile, will take the
user to the lowest level documentation functionality available on the
Metadata Editor. There is a great deal of information required to
document for each variable. The user will note the main sections of the
interface that are displayed:
icon of the individual datafile, will take the
user to the lowest level documentation functionality available on the
Metadata Editor. There is a great deal of information required to
document for each variable. The user will note the main sections of the
interface that are displayed:
The following main sections are noted: Variables, Documentation, Categories, Variable Information.
Variables
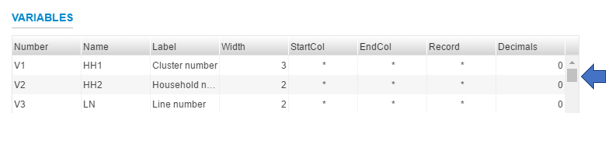
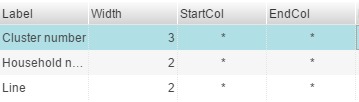
The Variable section of the interface provides a grid of all the variables in the data file. The user can scroll up and down the list by moving the scroll bar to the right.
Documentation
Note the following table below for a summary of the variable information available on the grid. The grid displays only default information. Note that a user can display more as desired. This is described later in the section.
E-The field is editable and can be modified by double-clicking into the field
NE-The field cannot me modified
CV-Controlled vocabulary
CB-Check box
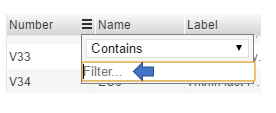
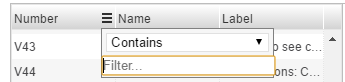
Note that each of the columns has a search functionality. By clicking the bars to the right of the column header, the user will be provided with a search filter. Simply insert the cursor in the field labeled “Filter” and the variable will be filtered in real time while typing the content being searched. The search can also be limited to the various options provided in the conditional box.
To the right of the variable grid, the user will notice the control options:
 |
New: This allows the user to add a variable at the end of the datafile. The user will be prompted to define the variable type. |
|---|---|
| Delete: This allows the user to delete a variable. The cursor must be in the grid in the position of the variable to be deleted. The user will be prompted to delete if this option is selected. | |
| The user can move a variable up or down in the list | |
| The ellipsis allows the user to display the variable information to display on the screen. These can be selected. Note the full list of variable information is provided in the section on variable information. |
Categories
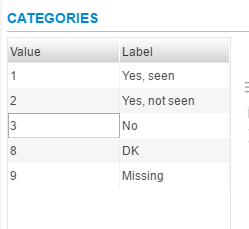
Categories are a vital form of metadata. These can be called value sets and they are the value that some numeric values take. A common category type can be a simple “Yes” or “No” response where the value for Yes is 1 and the value for No is 2. In the Metadata Editor, the categories that are defined are associated with nominal and ordinal variables. The datatype is usually defined as numeric and the measure is defined as nominal or ordinal.
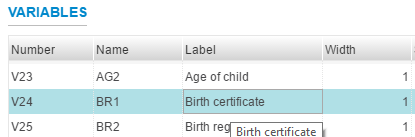
The categories will be displayed with the value and the label as shown.
Note that the variable is the response related to possessing a birth certificate.
 Categories can be maintained by selecting options from the
control to the right of the categories box. Just click the desired icon
for: adding, deleting and moving the category up od down in the list.
When adding a category, the application will append to the bottom of the
list and not insert. It may be necessary to create a value and then move
it up the category list.
Categories can be maintained by selecting options from the
control to the right of the categories box. Just click the desired icon
for: adding, deleting and moving the category up od down in the list.
When adding a category, the application will append to the bottom of the
list and not insert. It may be necessary to create a value and then move
it up the category list.
Variable Information
The Metadata Editor allows the user to browse and check the variable
information in different ways. As has already been shown, one way to
browse the variable information is to click on the ellipsis to the right
of the variable grid  .
.
This will display a list of options. The user can check those items to be displayed on the grid.
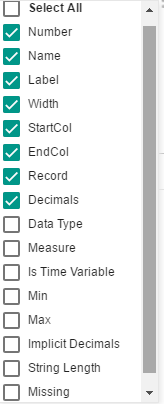 Note in the selection provided, the default values are
checked in green. An optional series of variable information can be
provided by simply selecting the item.
Note in the selection provided, the default values are
checked in green. An optional series of variable information can be
provided by simply selecting the item.
The user will also note that the unchecked items are represented in the screen display to the lower left under the title of “Variable Information”.
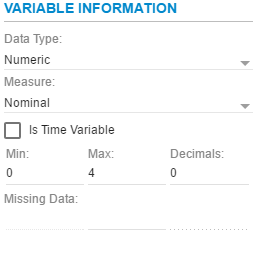
Data Type
Data type provides a drop-down box when clicking the  to the
right of the field that define the type of data for that variable. A
list of choices will be provided:
to the
right of the field that define the type of data for that variable. A
list of choices will be provided:
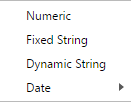
Numeric
Numeric variables are used to store any number, whether integer or floating point (decimal). When a dataset is imported the values within the variable are analyzed and the most appropriate storage format is used. This guarantees that the file takes up as little space as possible.
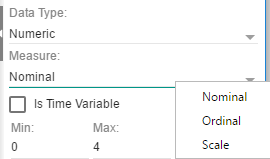 Selecting Numeric will also display a “Measure” field. This
will provide the user with the opportunity to define the numeric measure
used. The following measures can be selected:
Selecting Numeric will also display a “Measure” field. This
will provide the user with the opportunity to define the numeric measure
used. The following measures can be selected:
Nominal, Ordinal and Scale.
Nominal:
This is the simplest type of measure whereby we only have names and labels for categories. There is no order implied in the ordering of the categories and no one category is better, or greater than another.
Example: Marital Status 1. Married
- Single
- Divorced
- Widowed
Ordinal:
An ‘Ordinal’ measure has an implied order, or rank within the categories.
Example: How strongly do you agree with this statement…?
- Strongly agree
- Agree
- Disagree
- Strongly disagree
Scale
A ‘Scale’ variable contains numerical data that is generally ‘continuous’ in nature, and contains the actual response given.
Examples: What is your income for the previous month?
How many employees does your company employ?
Fixed string
A fixed string variable is a variable with a predefined length which can be set in the ‘String Length’ field below the ‘Data Type’ box.
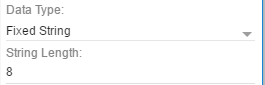
Using fixed string variables is very efficient as the strings are stored in an array and are fast to store and retrieve. A fixed string variable uses the same character set/encoding as the machine it runs on. There is no limit on the number of characters but some software such as SPSS may have character limits. It is recommended to keep a fixed string between 1 and 255 characters in length.
If the user changes the string length, the following warning message will be provided:
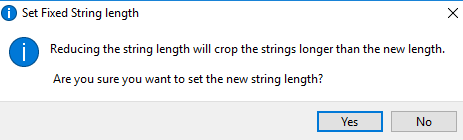
This warning message provides the user with a reminder that any value in the datafile for that variable will be cut or cropped to that length. Any trailing characters will need to be accounted for on the datafile.
Dynamic string
A dynamic string variable is a variable with no limit to its length. Each item of information is stored as a separate object in the file and is therefore much less efficient to store than fixed string variables and also takes more time to retrieve. However, unlike for fixed string variables, empty cells are not stored. Dynamic string variables are stored in Unicode format and should only be used only when a few cells contain long string information. Dynamic strings should not be used if the content of the variable is less than 20 characters in length.
Date
The date field is selected when storing date information. The user will note there are many options available when clicking the options arrow:
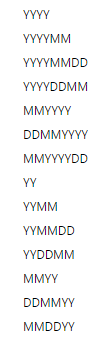
Note the designation:
Y is for year.
M is for month
D is for day
The number of characters for year, month or day is provided by the number of times the designation repeats:
YYYY is a four-character year
YY is a two-character year
The order in which the designation is provided is the order the year, month and day mush be entered.
Is Time Variable
If a dataset contains a ‘Time’ variable, e.g. Year, then the ‘Is Time Variable’ checkbox should be selected.
Min and Max
These two variable information options will display the minimum and the maximum values for that variable in the datafile.
Decimals
This field is used to define the number of decimal characters that are defined for the variable.
Missing Data
This is where missing values for the data are defined. When defining missing variables, the user will notice that the selected field where the cursor is will be indicated by a green bar below the field indicating that the field is active. In the case below, the value 9 would be considered missing data.

Variable Documentation
This section will cover the variable level documentation. Before going into detail on the documentation or metadata that can be displayed and related to the variable, note that the use will navigate through the variable list provided under the variable section. The highlighted bar will always indicate the active variable that is displayed on the “documentation” section. Moving the bar up or down will change the display of documentation.
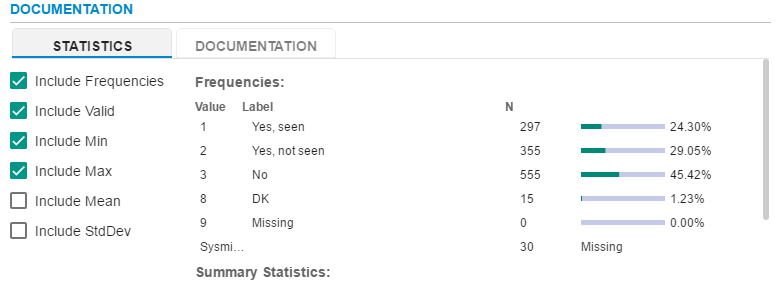
The Documentation section provides two tabs: Statistics and Documentation.
Statistics
The statistics tab will display the various selection of statistics available in the selection box. Not all statistics should be displayed for all variables. This will depend on the data type and measure. The user should take the time to browse the metadata available under the statistics tab to review the variables before documenting.
The following options are available. Each section will display some initials in parenthesis. These stand for: N=Nominal, O=Ordinal, S=Scale and St=String. The values in the parenthesis is the recommended statistics for the measure or data type contained. For example, there is no need to display a mean for nominal variables.
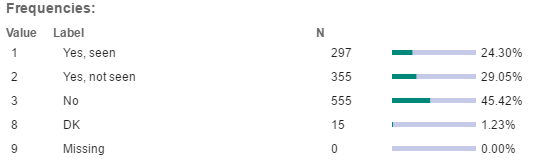
Include Frequencies (N,O)
Ticking the box entitled Include Frequencies will display the distribution of that response for the category provided. Both the value and label will be displayed with a horizontal bar chart and percentage displayed of the number of responses for that category.
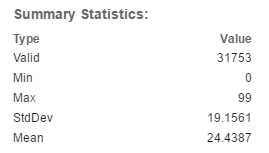
Summary Statistics
The remainder of the statistics will be displayed under the title: Summary Statistics. For the example provided, the summary statistics display the age of the head of household.
Documentation
Clicking the documentation tab will display a very important screen. The user will note a screen that provides entry fields that are grouped in categories and have the same appearance as documenting the higher-level categories. Each variable has its own collection of important metadata that should be documented if applicable.
The user will notice that the variable level documentation is organized into 4 folders:
Description: This section consists of four elements and describe the variable.
Question: This section is where the documenter will place question text such as the literal question.
Imputation and Derivation: this section identifies the variables that are computed or imputed.
Other: Other key elements that should be documented
The table below gives a summary of the elements available for documentation. Not all variables will have metadata associated with the element. The user should document what is pertinent and available to the user of the data.
Navigation Tips
The following tips are provided to help the user navigate through the frames and data entry fields.

The control found in the upper right of the category frame will allow the user to toggle the view of the frames from horizontal to vertical.
When navigating over a frame it may be difficult to see the scroll bar. Hover over the right- hand part of the frame and the scroll bar will appear

The user will notice a control on the margin of the vertical frames. This allows the user to expand or collapse the frame and make more room on the screen for documenting. The small whit indicator arrow will change depending on whether it is in the expanded or contacted position.
Data View
The Metadata editor provides the user with the facility to view the
data. The user will note that there is a Data node in the tree control
to the left . Clicking that icon will display a screen that
contains the rows and columns of data. This screen is not editable but
only allows the user the ability to browse the data.
. Clicking that icon will display a screen that
contains the rows and columns of data. This screen is not editable but
only allows the user the ability to browse the data.
 The user will also notice an ellipsis to the right of the
data icon. Clicking this will give the user the ability to import an
ASCII dataset.
The user will also notice an ellipsis to the right of the
data icon. Clicking this will give the user the ability to import an
ASCII dataset.
Quality Tips
The following tips are provided to the archivist in order to assure a high-quality product at the variable level. Documenting variables can be a tedious work to do correctly. But the value provided to the user of a well-documented dataset is critical to making the dataset use-friendly.
User: Always think about what the user needs. The archivist is documenting the project for users to discover information that would assist them in researching questions. Helping the user navigate through the variables and providing guidance as efficiently as possible may help the researcher discover important findings in the data as well as falling into error.
Review the ICPSR guide for documenting variables. This provides a valuable guide to naming and labeling conventions. The ICPSR guide should be a companion to documenting a project. https://www.icpsr.umich.edu/icpsrweb/content/deposit/guide/
Always check the variable statistics and assure only the necessary statistics are displayed. For example, don’t display the mean and standard deviation for nominal variables.
Make sure the nominal variables are properly labeled or described in the categories.
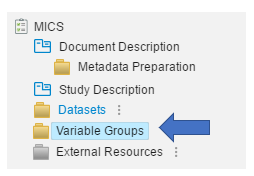
Variable Groups
Variable groups are applicable for those projects that have data. Variable groups are virtual groupings of variables and are intended to help the user browse data that can be grouped under a subject. Variables in a survey can be found in many different sections of data files. Variable groups bring these all together for easier exploratory browsing or review.
Variables can be grouped by themes or related subjects. For example, a group of variables under “Employment” could group personal characteristics from a household roster (such as age or sex) and include them with employment questions or income questions and entitle the group: Labor.
Variable groups can be accessed by clicking the node in the tree entitled “Variable Groups”.
This will display the following screen:
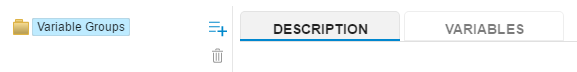
The user will notice the two tabs to the right. These will help organize the process of grouping. Variable groups can also allow for nesting sub-topics or sub-groups. I may want to classify Labor and have subgroups: formal and informal.
Creating and Deleting Variable Groups
Variable groups are created by clicking into the “Variable Groups” section and clicking the relevant control:

The (+) will create a variable group and provide it with the default value “Variable Group X”.
The trash-bin below will allow the user to remove a variable group/
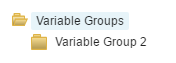 After creating a variable group note the default value
“Variable Group X” is provided. These will need to be labeled under the
“Description” tab.
After creating a variable group note the default value
“Variable Group X” is provided. These will need to be labeled under the
“Description” tab.
When deleting a variable group, simply highlight the group. The delete control will show blue when active.
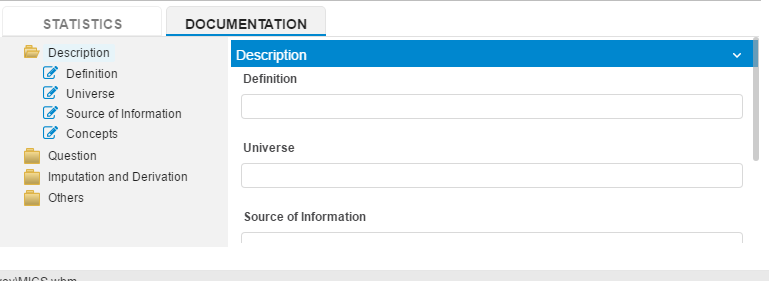
Describing the variable groups**
View the available information under the description tab. This work area will allow the user to describe the group.
Adding variable to groups
Having described the various folders, it is possible to now add the variables into the group. Click the Variables tag. Note the following display:
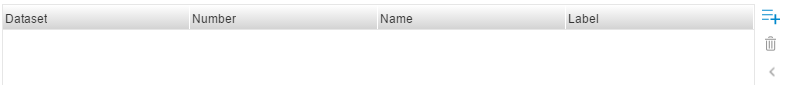
This shows a blank slate awaiting the variables assigned to the folder. Note that the display will show the dataset, the variable number, the name of the variable and the label. This process of reviewing can also add to the quality of output by obliging a review of the variable level metadata.
 Note the control to the right of the grid:
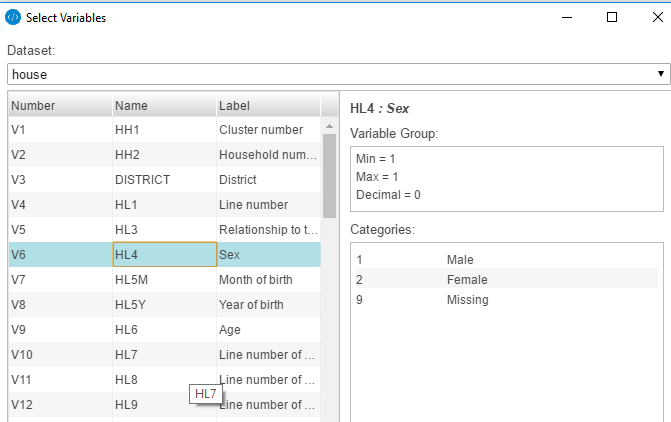
Variable Selection Box
Clicking the (+) will display the following box. This will provide the user with a grid of variables to be selected. Note the drop-down box under the title: Dataset. Clicking the arrow will allow the user to select the datafile in the dataset from which to select the variables to be assigned to the group.
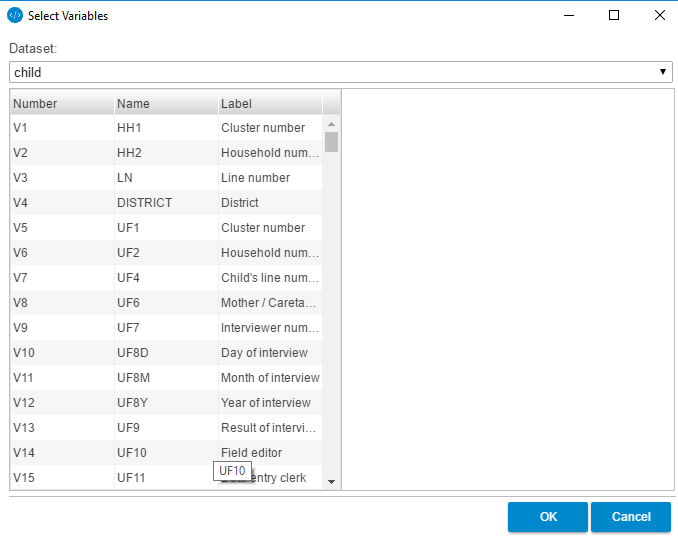
The user can browse the selection and click the variables I want one by one by highlighting and adding to the grid by clicking the (+). When selecting a variable, note that the display to the right will show some summary statistics.
Clicking the OK button will add the variable or variables to the group.
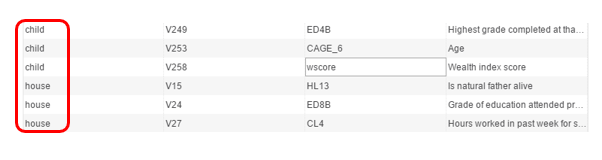
Adding variables across the dataset
The advantage of grouping variables is that variables across datafiles in the dataset can be displayed. Note in the example below the datafile identifier. This group will contain variables assigned from the “child” file and the “head of household”.
Deleting variables in a group
If the user wants to delete variables in a group, simply highlight the variable and click the trash bin.
Navigation
It is useful to understand how to navigate through the variables to increase productivity. The following section gives some hints and insights into the navigation of variable groups.
Searching the files
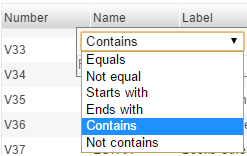
The user can filter through the variables in the datafile by clicking to the left of the column header on the variable grid. This will display a filter control and the user can select the criteria for which they want to filter.
The choices provided are shown below:
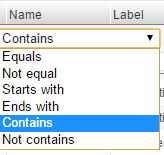
The user would select the condition and then enter the search text in the search box.
Returning to the original datafile
 The user will notice the small arrow
  in the
series of controls provided at the right side of the work space when in
the variable tab.
in the
series of controls provided at the right side of the work space when in
the variable tab.
Clicking the arrow will take the user to the datafile for that variable in the Datasets. Notice when clicking the arrow, the application will move into that section and the user no longer has control of the variable group.
External Resources
Section 1 discussed the process of preparing a project. This process required the gathering of reports, manuals and documents that would help explain the project. Up to this point the metadata capture and the documentation process was focused on developing the metadata document structured by the metadata standard: DDI or ISO 19139 and through entry of information in fields that correlate to the standards. These related to project types with data such as: surveys and time series or geospatial data.
However, capturing the metadata also means conveying certain key documents to the user. Not all the detail of a project can be captured in the fields that are provided in the project templates. Providing the user with the original source documentation can be a very valuable addition to the project. A user may find it useful to refer to discrete, related documents such as: survey questionnaires, enumerator manuals, survey reports, methodological documents.
Each of these electronic documents can be attached to the project and form part of the dissemination package that should be available to the researcher.
The metadata standard used to describe these stand-alone documents is called the Dublin Core Metadata Initiative or DCMI..
Dublin Core
The Dublin Core template used by the Metadata Editor consists of the following elements.
| Element | Dublin Core Group | Metadata Editor |
|---|---|---|
| Type | Content | Identification |
| Title | Content (IHSN) | Identification |
| Subtitle | Identification | |
| Authors | Creator: Intellectual Property | Identification |
| Date Created | Instantiation | Identification |
| Country (Coverage) | Content | Identification |
| Language | Instantiation | Identification |
| Format | Instantiation | Identification |
| ID Number | Instantiation | Identification |
| Contributors | Intellectual Property | Contributor (s) and Rights |
| Publishers | Intellectual Property | Contributor (s) and Rights |
| Rights | Intellectual Property | Contributor (s) and Rights |
| Description | Content | Content |
| Abstract | Content | |
| Table of Contents | Content | |
| Subjects | Content | Content |
Managing External Resource
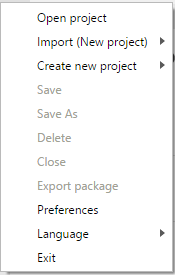
There are three options that are available for managing external
resources. Right clicking on the  will display the choices:
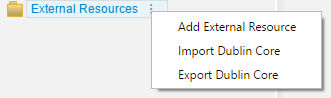
- Add External resources
- Import Dublin Core
- Export Dublin Core
 Note that the template can be selected by clicking the
pencil icon
Note that the template can be selected by clicking the
pencil icon  when at the highest node in the “External
Resource” tree. In case the user wants to modify the Dublin Core, he or
she will need to go into the Template Manager and select the “Dublin
Core” tab and then modify accordingly. The modified template will then
be available and listed when returning to the template selection area
and clicking the .
when at the highest node in the “External
Resource” tree. In case the user wants to modify the Dublin Core, he or
she will need to go into the Template Manager and select the “Dublin
Core” tab and then modify accordingly. The modified template will then
be available and listed when returning to the template selection area
and clicking the .
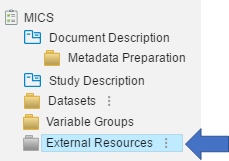
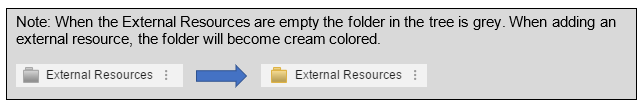
To add an external resource, click on the to the right of the
node entitled External Resources. This will display a choice of options.
Select “Add External Resource”. Notice that a new node has been created
under the External Resources with the default name: Resource 1 (the
number assigned is a sequential number).
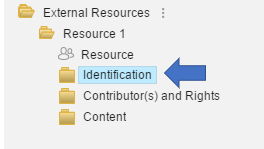
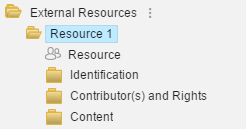 Note that all the DCMI elements have been grouped into the
three folders that are now available: Identification, Contributor(s) and
Rights and Content.
Note that all the DCMI elements have been grouped into the
three folders that are now available: Identification, Contributor(s) and
Rights and Content.
The most important steps before adding the descriptive elements is the need to change the display title and linking the resource.
Linking the External Resource
One of the most important parts of assuring that the external resource
is provided to the user is to assure that a link to that reference is
provided. Note after adding the External Resource there is a node with
the outline of two persons:  . Click this node and note the
screen in the workspace. There are two choices for linking the external
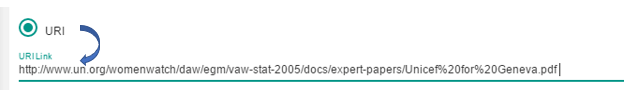
resource: URI or File.
. Click this node and note the
screen in the workspace. There are two choices for linking the external
resource: URI or File.
URI: This stands for Uniform Resource Identifier. The user should insert the location of the file. This is usually a web address that is accessible through http or https. Often, publications may already be available on-line as a PDF and can be accessed through the URI (in this case the location of where the document is found on the web). For example: http://www.un.org/womenwatch/daw/egm/vaw-stat-2005/docs/expert-papers/Unicef%20for%20Geneva.pdf is a URL that provides a link to the PDF. Simply click the URI radio button and place the link in the field provided.
Note that the link can be checked by clicking the  icon at the
right of the field. In this case
icon at the
right of the field. In this case
the document will be downloaded as it refers to a PDF.
File: In preparing the external resources, it was recommended that all external resources be placed in a separate folder. Each of these files can be linked as required. Click the File radio button and select the file that should be added as an external resource. Note that there are two control icons at the rig hot the file path entry field.
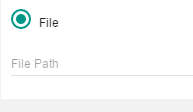 Clicking the first icon first icon
  will allow the
user to browse the files using Windows Explore and link to the
appropriate document.
will allow the
user to browse the files using Windows Explore and link to the
appropriate document.
The second icon  allows the user to upload the document into
the project.**
allows the user to upload the document into
the project.**
Changing the title
 When creating an external resource, the Metadata Editor will
automatically provide a default name “Resource X” where X is a serial
number that is generated based on the number of resources that have been
added. In order to change the name click on the “Identification” folder
and go to the field named “Title”. Note there is an asterisk to the
right of the label “Title”. This indicates that the field is a required
field. Note that the default title “Resource 1” in this case changes to
the actual title input into the field.
When creating an external resource, the Metadata Editor will
automatically provide a default name “Resource X” where X is a serial
number that is generated based on the number of resources that have been
added. In order to change the name click on the “Identification” folder
and go to the field named “Title”. Note there is an asterisk to the
right of the label “Title”. This indicates that the field is a required
field. Note that the default title “Resource 1” in this case changes to
the actual title input into the field.
Documenting the external resources
After the external resource has been linked and properly titled, the user can then document the elements of the Dublin Core. A table is provided with references to the kind of content that should be included in the field.
| Type | This is crucial information. A controlled vocabulary is provided. The selection of the type is important as it determines the way it will be presented or displayed to the user in the final output in the National Data Archive Application. The following are the choices:
|
|---|---|
| Title | Full and official title of the document. It would be provided on the cover page. If no title is provided, then provide a descriptive title or heading for the document. It should be prominently apparent. |
| Subtitle | An explanatory or alternate title. This could be set apart by a colon. |
| Author (s) | Include all authors that are listed on the report and that substantively contributed to the content of the document. |
| Date Created | Date of the publication of the report or resource (at least month and year). For reports, this is most likely stated on the cover page of the document. For other types of resources, put here the date the resource was produced. |
| Country | Note that this field allows for multiple selection. These are the county or countries that are the focus of the document or resource. |
| Language | The language of the document. Use the controlled vocabulary provided. |
| Format | The file format provides information on the kind of electronic document being documented. This includes: PDF, Word, Excel etc. This is a controlled vocabulary. |
| ID Number | A unique number which references the document. This could be an internal document number or a Library of Congress number or a World Bank Publication number. It uniquely identifies the document. |
| Contributors | Include the names of all organizations that have been involved or contributed to producing the publication. This included funding sources as well as authoring entities. |
| Publishers | Include the official organization(s) accredited with producing the report. |
| Rights | The copyright statement on the publication. |
| Description | A brief description of the resource. |
| Abstract | A brief summary of the document used to help the reader quickly understand the paper’s purpose. |
| Table of Contents | Include the table of contents if available. It is not necessary to include the page numbers. This could also simply be the main sections of a document that help describe the content |
| Subjects | Include a summary of the major subjects which have been covered by the report. This list of subjects should be taken from a standard multilingual thesaurus for cross referencing and searches. |
**How to delete an external resource?
Importing and Exporting the Dublin Core
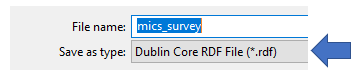
In addition to adding a resource, the Metadata Editor allows the user to
import and export the Dublin Core. This can be done by returning to the
top most node in the External Resource tree and click the  icon and selecting the appropriate choice. Selecting the will
provide the user with a Windows Explored screen where the Dublin Core
can be selected (imported) or saved (exported). When importing or
exporting the Dublin Core the file format will be .rdf. If importing or
exporting an .rdf file with multiple documents, all document references
will be available.
icon and selecting the appropriate choice. Selecting the will
provide the user with a Windows Explored screen where the Dublin Core
can be selected (imported) or saved (exported). When importing or
exporting the Dublin Core the file format will be .rdf. If importing or
exporting an .rdf file with multiple documents, all document references
will be available.
Project Types using the Dublin Core
Although external resources can be attached and linked to a project such as a survey, there are also two project types that reflect the Dublin Core. The user will notice that the templates for Tables and Documents are based on the Dublin Core.
Quality Tips
- Always have all the documents available in a specific folder. It is often helpful to group the documents according to the “types” as provided in the Metadata Editor.
- Always double check the path for files that are provided. These should be relative paths.
- When cutting and pasting content, always check to make sure that the spacing and special characters are properly displayed.
- Double check the output and make sure that the content is properly conveyed to the user and is useful for research purposes.
- Provide as much relevant documentation to the user. If the project is a survey be sure to include the questionnaires and any survey reports with methodological details.
Publisher Menu Items
This section contains a comprehensive reference list of each menu item and includes information about each item, what it does and how it can be used. The menu items are illustrated in the screen shot below.

File Menu
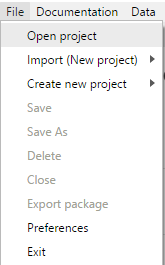
 The following options are available under the File Item:
File>Open
Opening a project allows the user to browse the computer or network using Windows File Explorer to access and use an already created Project. When the project is successfully opened, a new tab will be created providing the user with the workspace for the project. The project is opened using a specific project extension file. This file contains pointers and instructions that will keep all the associated files referenced. Opening a project is usually used on the computer of the archivist that is working on a project. When sharing information with others, an archivist will need to consider the formats. The formats for sharing projects are covered under File>Import (New Project).
File>Import (New Project)
Projects can be shared in different formats. Because project documentation may use many references an archivist may want to be selective in sharing a project. The format may include: data, external resources or just metadata. There are several options available when importing a project. These first require that files for import have been created under File>Export or File>Documentation. Recreating a full project may require more than one import operation.
File>Import (New Project)>Package**
A package is a zip file that contains a full project and the associated data and documentation. The package must first be saved out (see File>Export package for details). This option is used when sharing a full project with all associated data and external resources.
File>Import (New Project)>DDI (Codebook 2)
This option imports the DDI codebook 2. This is the metadata schema of the DDI XML that is supported by the Metadata Editor. This format will not carry any data or external documents and is only used in the case of sharing the documention of a survey or census type project that would use the DDI.
File>Import (New Project)>Geospatial (ISO19139 XML)
This option is used only for importing the geospatial XML in ISO 19139 format.
File>Import (New Project)>Dublin Core/RDF**
This option would be used for importing the Dublin core. The format does not carry the external resources. If the RDF contains documentation on external resources, the physical document will need to be provided separately and linked. This option would also be used when importing a “Tables” or individual document project.
File>Import (New Project)>Nesstar Study**
This option will allow the user to import Nesstar files. The Nesstar format is a proprietary format that is a legacy format for many statistical offices. This file format contains the data but not the external resources of a project. This option would be used by a statistics office or agency that has documented many projects using the Nesstar Publisher and wants to review or update the file formats to the new Metadata Editor format.
File>Create new project
The File>Create new project will display a sub menu consisting of the following:
This option is used when creating a new project. Selecting any one of these submenu items will have the same result as opening a project as discussed in Section 2. A new tab will be created for the new project. The File>Create new project can be used with the File>Import (New Project) to overlay existing project documentation on a new project.
File>Save
The File>Save option is only available when never having saved a project. When a project has been created, notice that a default name is given of “New Study #. A sequential number will be provided to the New Study by default. When selecting the save option the application will prompt for a file name. Be sure to provide it a name that will identify the project.
If the project has already been saved, the File>Save option will be grayed out. The project name is retained in memory and only changes to that document will re-activate the File>Save. If the option is greyed out and the project needs to be saved for any reason, make sure the next option is selected, which is File>Save As.
File> Save As
This option allows saving a project and overrides the File>Save option (if it is greyed out). The project can be freely named or saved in any location and with any name.
File>Delete
The File>Delete option will completely remove the project file from the computer. It will not delete the data or the external resources that have been linked. The data and documents remain in their folder. Only the references to the data and external resources will be deleted as will the project file.
File>Close
The File>Close option will close the current project. The user will be prompted with an option box to save the project before closing. The user can save or opt to close without saving.
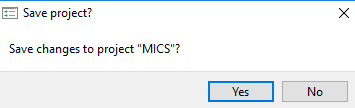
File>Export Package
This option will save the project and all resources and data associated with the project in a zip file. When selecting this option, the user will be prompted to provide a name for the zip package.
The zip file will contain the following items:
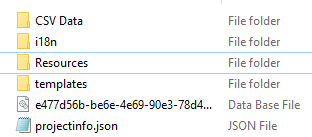
Note:
CSV Data: If data has been attached to a project, the packaging will convert the file to a comma separated value format. Each data file will be saved out as a CSV.
The I18n folder contains a JSON file with language specific parameters.**
The Resource folder contains all external resources that have been linked to a project
The template folder contains the specific template that was used to document the project
The Data base file contains all the metadata associated with the project. The application makes use of a database to manage the metadata of a project.
The projectinfo JSON file contains the key instructions (as text) and parameters required by the application to recreate the structure including: data files, metadata and exteral resources.
File>Preferences
The Metadata Editor makes use of the R package. Because the R package used requires various dependencies the Metadata Editor ships with a version of R and required dependencies. The only option available is to not use the default version of R. Note: This preference is rarely changed and would require programming knowledge in R and changing the version will likely result in performance failure.
File>Language**
This option allows the user to change the language of the interface of the Metadata Editor. It will also provide the instruction to creating the language file used in the Export>Package option.
Exit
Selecting this option will exit the application entirely. The application is closed and no longer available on the taskbar. If changes have been made to the project, the user will be prompted to save the changes before exiting the application.
Documentation Menu
The Documentation menu option allows the user to import or export the various metadata standards that are now included in the Metadata Editor. The term “Documentation” is used to define the content that is available in a standardized format and is designed for sharing content.
The options that are available in the sub menu are:
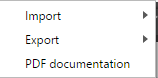
Documentation>Import
Importing a document allows users of the Metadata Editor to import the metadata of a project. This function has much of the same functionality found under the File>Import option. However, the Document>Import only uses project metadata files. This is useful when sharing metadata content. This functionality can be very useful when dividing up labor and assigning tasks to different persons for the same project.
The user is provided with a series of submenus depending on the metadata required by the project. Note the following options:
- DDI: This is the metadata content associated with a survey or a census.
- Dublin Core: This is the documentation associated with any external resources that have been linked to a project.
- Geospatial (ISO 19139): This is used to import geospatial metadata
- Document: This is used for stand-alone documents and follows the Dublin Core.
- Table: This option is used to import the document of a table. It also follows the Dublin Core.
- Package: This will import a zip file with all related data and external resources. This has the same effect as the File>Import>Package option.
When importing a DDI or a package file, the user will be provided an option to import sections of the project document. The archivist can select the specific sections to be imported.
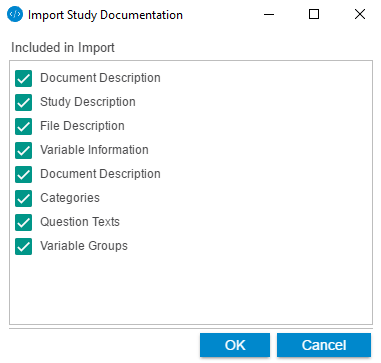
The table provides descriptions of the primary sections which can be imported:
| Item | Description |
|---|---|
| Document Description | This is the highest-level metadata and describes the document. |
| Study Description | These are the metadata elements that describe the specific project or data collection. This could be the survey description of a survey project. |
| File Description | These metadata define the various data files associated with the project or study. |
| Variable Information | These are the variable labels. For the import to work, the data file must be in the receiving document and the variable names must match between the import document and the receiving document. |
| Variable Documentation | These are the variable level information that include elements such as: definition, source of information, and other descriptive elements. |
| Categories | These metadata are the response category labels. |
| Question Texts | These metadata include the pre and post question texts, instructions and the literal question. |
| Variable groups | If groups have been defined in the original document, and if the variable names match, the groups will be created. |
Note: Make sure that the template used by the document being imported is available in the work environment. The template can be imported automatically if the project is saved as a package.
Documentation>Export
The Documentation>Export option will allow the user to export the project in three formats: DDI, RDF and JSON.
- DDI
This is primarily used for survey projects. When exporting a DDI document, the Metadata Editor is designed to undertake a quality check that includes assuring that any mandatory fields defined in the template are not empty. Trying to export a DDI with any of the fields empty, will generate the following alert:
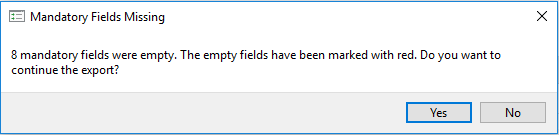
The example provided is based on the default DDI template and in this case included 8 mandatory fields. In this example, the mandatory fields are:
DDI Document ID Number
Title
Study ID Number
Country
Primary Investigator
Dates of Collection
Citation Requirement
Disclaimer
- Dublin Core/RDF
The Dublin Core export will produce a Dublin Core document of the metadata of all the external resources that are linked to a project. Note that the document will not package the actual reference documents but provide only the metadata. The documents would have to be exported as a package under the File>Export Package document.
- JSON
Exporting the JSON file will produce a Java Script Open Notation document. This is a lightweight exchange format that is easy to parse and use in applications.
Documentation > PDF Documentation
PDF stands for Portable Document Format. It is a file format that captures content and shares it across platforms. A PDF is free from viruses and is a common way to distribute content. In order to view the PDF the computer being used will need a copy of Adobe Acrobat. This is free software available at the Adobe Acrobat web site:
https://acrobat.adobe.com/us/en/acrobat/pdf-reader.html
Generating a PDF and not having the Acrobat Reader will result in being unable to read the document that was generated.
Variables Menu
There are three options for managing variable level information. These are:
- Resequence
- Spread metadata
- Destring
Resequence
The ‘Resequence’ option defines the column lengths of an ASCII file. Resequencing effectively defines the variable lengths (characters) in the data file or the data dictionary that serves as the template defining the variable dimensions.
The ‘Resequence’ option recalculates the Start Column and End Column positions for the variables using information in the Widths column. For example, if a variable has a width of 4 and a start column of 16, the end column will be 19, i.e. the width of 4 spans columns 16, 17, 18 and 19.
The correct widths will also be calculated from the data using this option.
When exporting to SPSS syntax or ‘Fixed format ASCII’, the start and end column information must be present. If this is missing an error message will be displayed requiring the use of the resequence option to add this information to the data. Once this has been added the export function will work correctly.
Steps to perform Resequencing:
- Select a dataset and click on the ‘Variables’ section
 .
Note that the definition of the columns are not provided and are
filled with *.
.
Note that the definition of the columns are not provided and are
filled with *.
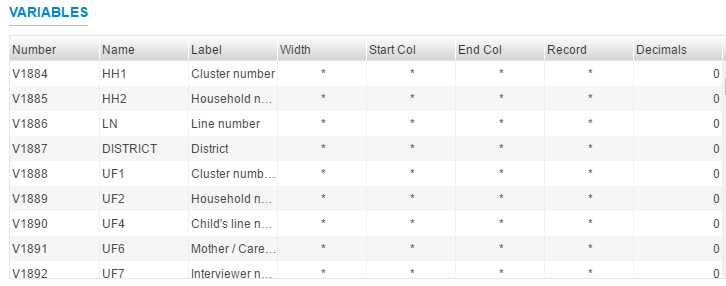
- Select the Variables>Re-sequence option and the Metadata Editor will compute the start and end columns. Note the resulting table will display the proper information and define the basic data structure.
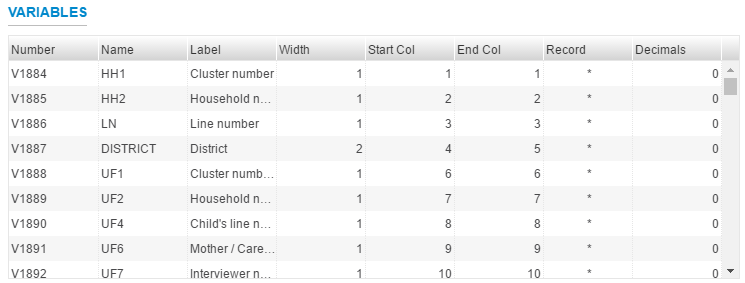
- The data file can now be exported as fixed format ASCII.
Spread Metadata
Spreading metadata is a useful option to take variable information from one file and impose the metadata on variables with the same name in other data files. If there are common variable in all data files such as IDs or personal attributes such as age or gender, spreading the metadata will apply the matched variables across the files. The file of reference is the data file where the cursor is located.
The example provided spreads the metadata from the variable DISTRICT to three other data files where the DISTRICT variable is also located.
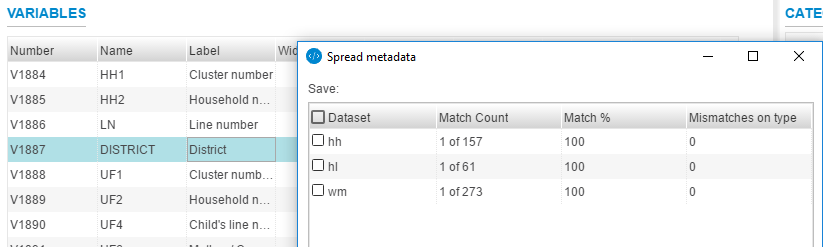
The following steps are required to spread the metadata across variables in the data files.
Open the data file with the reference variable and place the cursor in the variable with the desired metadata to be spread. The variable will be highlighted in blue.
Select the Variable>Spread metadata option. A control box will be provided with all the files that have a matching variable. In this case, three data files have the matching variable “DISTRICT”. Select the data files that are the target of the reference metadata.
Note the metadata categories that can be spread:
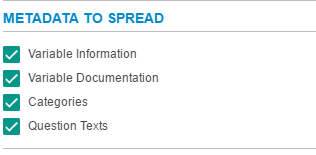
Select the metadata items to spread. These will be shared in all corresponding variables in matched files.
Select the “Spread Metadata” option to share the metadata to the other data files. Now all corresponding DISTRICT variables will have the same content.
Destring
The Variable>Destring option will allow the user to change a string variable to a numeric variable. To do this, the user must select the variable to destring. Once the operation is complete, the application will display a screen with the variable that have undergone destringing.
Tools Menu
Under the Tools Menu item there are three options provided. These include:
- Validate Metadata
- Validate External Resources
- Translation Manager
Validate Metadata
This is a simple quality control step that assures that the mandatory elements of a project template have been filled in. Mandatory elements are defined in the template of each specific project. Using this option will display a box with the validation result, in this case, 8 mandatory fields are not completed.
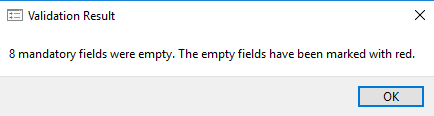
As indicated by the message, the elements that are not filled in will be marked in red.
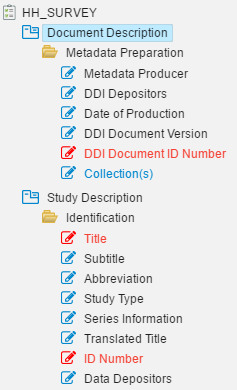
Validate external resources
Like the validation of the Tools>Validate metadata, this option will check that the mandatory elements of the Dublin Core have been completed. As with the validation of the metadata, a result will be displayed in a box to the user.
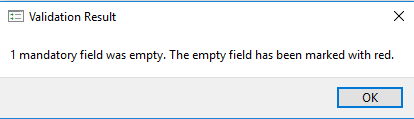
The user should assure that all mandatory elements have been completed.
Translation manager
The Template Manager provides the user with the ability to translate the interface of the Metadata Editor into any language. Selecting this option will display the Translation Manager interface. When using the option for the first time, the English template will be displayed with all the labels that require translation.
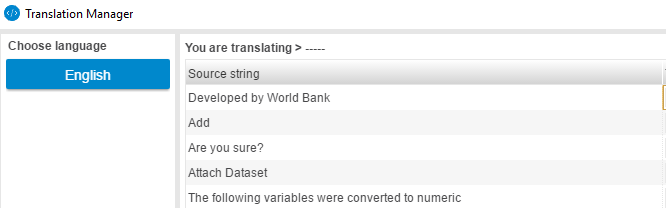
Note the following steps for creating a new language template.
Click the NEW option to the right of the Translation Manager screen. This will provide the user with a new file. The user must complete the two fields provided: 3-letter ISO code for the language and the name of the language. Once this has been done, click the SAVE button.
Note that a new language tab has been created. This language tab is open and will allow the user to enter content into the open fields. The translator should complete the fields by entering the corresponding translation to the right.
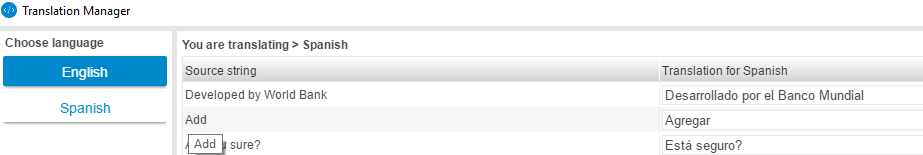
Save the work by clicking the SAVE button.
The user may now select the new language under the File>Language by selecting the desired language
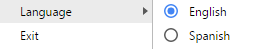
The interface will now display the labels and tags in the selected language.
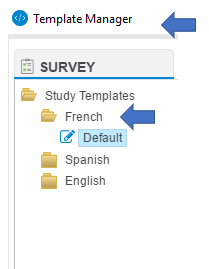 Note that the template must also be translated to assure
the full content is in the desired language. The Translation Manager
will only translate the interface and not the metadata labels. To
translate the template use the Template Manager and check under the
language folder and follow the procedure outline in the Template
section 2.3**.
Note that the template must also be translated to assure
the full content is in the desired language. The Translation Manager
will only translate the interface and not the metadata labels. To
translate the template use the Template Manager and check under the
language folder and follow the procedure outline in the Template
section 2.3**.
There are various other options available in the Translation Manager. These include:
Edit: Allows the translator to edit the language specification or the ISO code and the language name.
Export: The language file can be exported as a ZIP file. This is useful if the user wants to share the language file with others.
Import: The user can import a language file that has been exported in ZIP format. Importing the language file will provide the user with the translated interface.
Close: The close option will close the interface. If any changes have been made in the language file, the Metadata Editor will prompt the user to save the changes.
There are three options available under this menu item.
- Templates
- Data types (schema)
- Import Schema
Templates>Templates
The Template>template selection allows the user to work with the
template manager. This selection will have the same effect as clicking
the  in the black control bar. This control has been discussed
in detail in the section entitle Templates (Section 2.3**).
in the black control bar. This control has been discussed
in detail in the section entitle Templates (Section 2.3**).
Templates>Data types (Schema)**
Templates>Import schema
Selecting this option will take the user to the Windows Explorer with the objective of selecting a JSON file schema of a template. In order to use this option, a schema of the template has to be generated in the Template Manager. The Template Manager provides an option to export the template in JSON format. This file can then be shared and imported.
Note: This JSON file is also generated when using the “Package” option and is found in the “Template” folder of the package.
Window Menu
The View Menu provides various options to the user for viewing the screen content. The following options are provided:
Minimize (Ctrl+M)
Selecting this option has the same effect as selecting the minimize button in the upper right hand of the screen. It will effectively reduce the application to the Windows application bar.
Reload (Ctrl+R)
This option reloads the content from the latest saved project file. Note: If changes have been made to the current document and not saved, the changes will be lost when reloading. The content is always taken from the latest saved version.
Close
This option will close the application and has the same effect as the File>Exit option. The user will be prompted to save the project before closing.
Under the Help menu the user will find two options: Heath Check and About:
- The Health Check display a popup window that provides some information and diagnostics regarding the R package. The Metadata Editor uses R to import and export the data. The health check option tells the which version of R is being used on the machine. In addition the Health Check will provide information on the Environment Path and the result of the execution of the R script.

- The About selection is standard choice in applications and provides information about the most recent version of the software. If a user requires information on the version of the software, selecting Help>About will provide a pop-up box for quick reference.
| [1] | See Wikipedia: https://en.wikipedia.org/wiki/Geospatial_metadata |
| [2] | Taken from the DDI web site. |
| [3] | Taken from the Dublin Core website at: http://dublincore.org |